Entity Relationship Diagram
The Entity Relationship Diagram explains the relationship among the entities present in the database. ER models are used to model real-world objects like a person, a car, or a company and the relation between these real-world objects. In short, the ER Diagram is the structural format of the database.
Why Use ER Diagrams In DBMS?
- ER diagrams are used to represent the E-R model in a database, which makes them easy to be converted into relations (tables).
- ER diagrams provide the purpose of real-world modeling of objects which makes them intently useful.
- ER diagrams require no technical knowledge and no hardware support.
- These diagrams are very easy to understand and easy to create even for a naive user.
- It gives a standard solution for visualizing the data logically.
Symbols Used in ER Model
ER Model is used to model the logical view of the system from a data perspective which consists of these symbols:
Entity
An entity can be a person, place, object, event, concept in the user environment about which the organization wishes to maintain data. Entities are represented by rectangle and are labeled using nouns. For example, a school system may include students, teachers, major courses, subjects, fees, and other items.
There are two basic types of an entity:
- Strong entity – entities which can stand on their own.
- Weak Entity – entities that depend on the existence of another entity. It cannot be identified by its own attributes
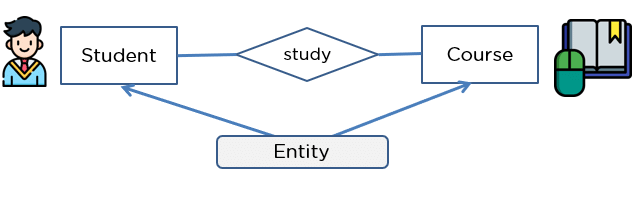
Entity
An entity can be either a living or non-living component.
It showcases an entity as a rectangle in an ER diagram.
For example, in a student study course, both the student and the course are entities.
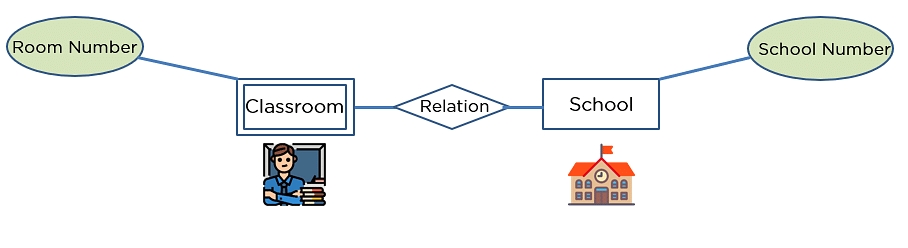
Weak Entity
An entity that makes reliance over another entity is called a weak entity
You showcase the weak entity as a double rectangle in ER Diagram.
In the example below, school is a strong entity because it has a primary key attribute - school number. Unlike school, the classroom is a weak entity because it does not have any primary key and the room number here acts only as a discriminator.
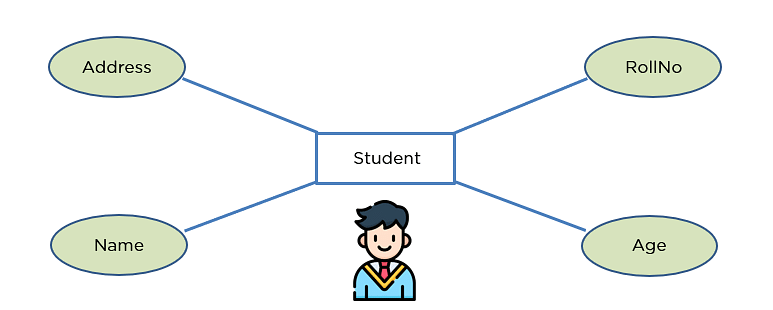
Attribute
An attribute exhibits the properties of an entity.
You can illustrate an attribute with an oval shape in an ER diagram.
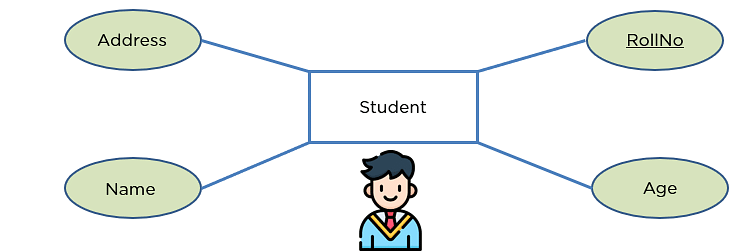
Key Attribute
Key attribute uniquely identifies an entity from an entity set.
It underlines the text of a key attribute.
For example: For a student entity, the roll number can uniquely identify a student from a set of students.
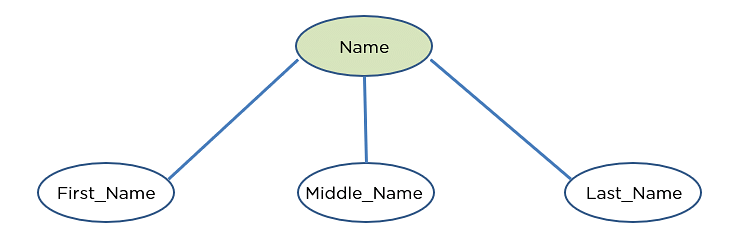
Composite Attribute
An attribute that is composed of several other attributes is known as a composite attribute.
An oval showcases the composite attribute, and the composite attribute oval is further connected with other ovals.
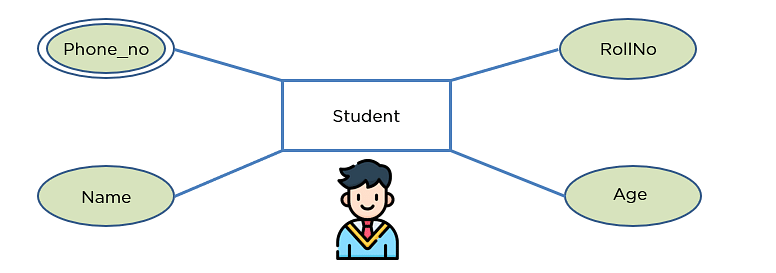
Multivalued Attribute
Some attributes can possess over one value (eg contact no. have more than one for one person), those attributes are called multivalued attributes.
The double oval shape is used to represent a multivalued attribute.
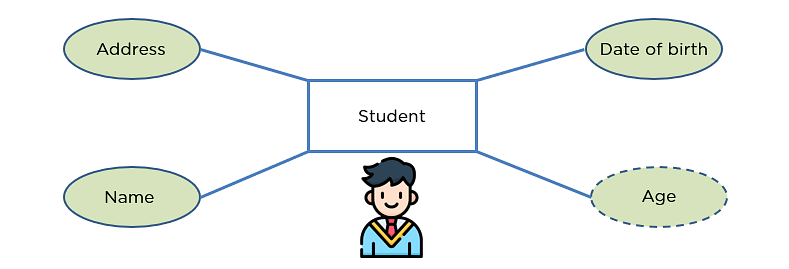
Derived Attribute
An attribute that can be derived from other attributes of the entity is known as a derived attribute.
In the ER diagram, the dashed oval represents the derived attribute.
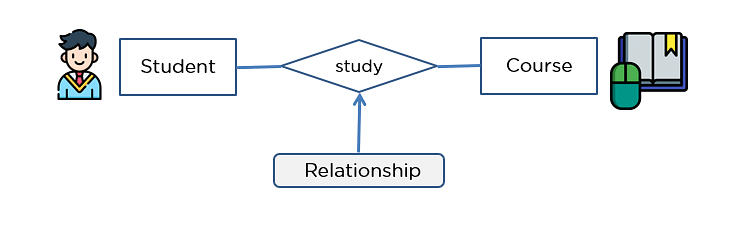
Relationship
The diamond shape showcases a relationship in the ER diagram.
It depicts the relationship between two entities.
In the example below, both the student and the course are entities, and study is the relationship between them.
One-to-One Relationship
When a single element of an entity is associated with a single element of another entity, it is called a one-to-one relationship.
For example, a student has only one identification card and an identification card is given to one person.

One-to-Many Relationship
When a single element of an entity is associated with more than one element of another entity, it is called a one-to-many relationship
For example, a customer can place many orders, but an order cannot be placed by many customers.

Many-to-One Relationship
When more than one element of an entity is related to a single element of another entity, then it is called a many-to-one relationship.
For example, students have to opt for a single course, but a course can have many students.

Many-to-Many Relationship
When more than one element of an entity is associated with more than one element of another entity, this is called a many-to-many relationship.
For example, you can assign an employee to many projects and a project can have many employees.

How to Draw an ER Diagram?
Below are some important points to draw ER diagram:
- First, identify all the Entities. Embed all the entities in a rectangle and label them properly.
- Identify relationships between entities and connect them using a diamond in the middle, illustrating the relationship. Do not connect relationships with each other.
- Connect attributes for entities and label them properly.
- Eradicate any redundant entities or relationships.
- Make sure your ER Diagram supports all the data provided to design the database.
- Effectively use colors to highlight key areas in your diagrams.


No comments:
Post a Comment